B2B Process Intelligence Dashboard
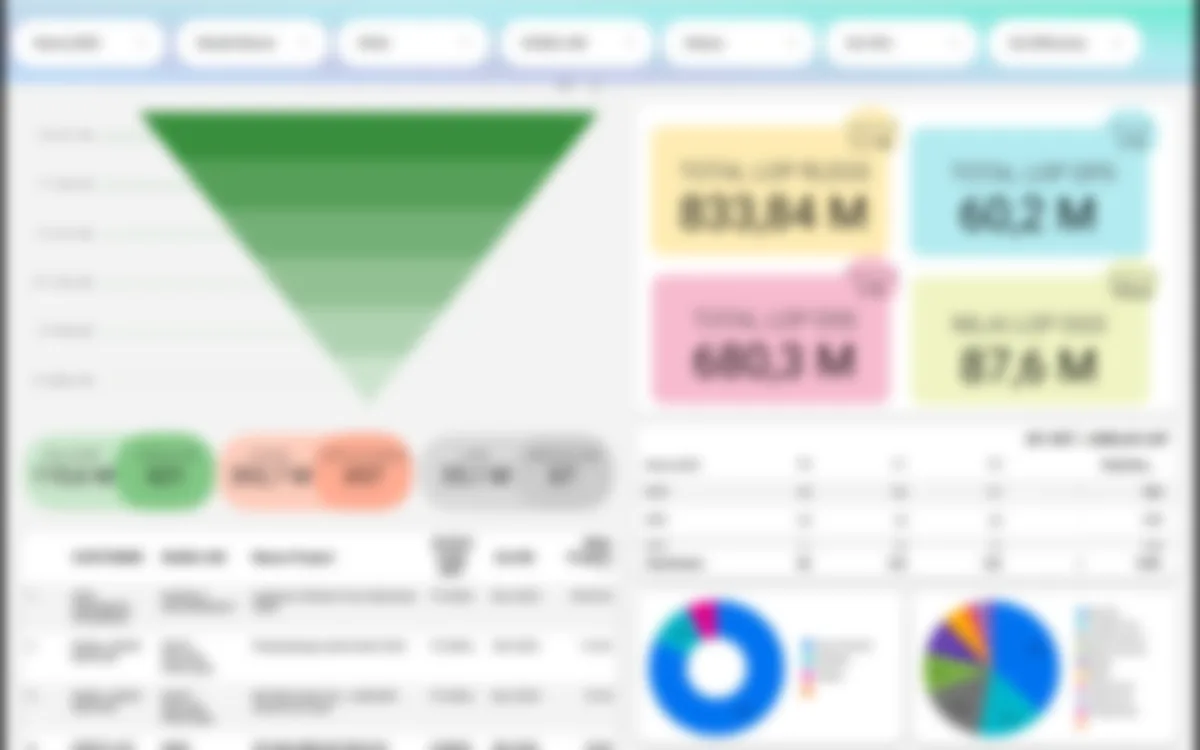
End-to-end monitoring of the B2B order lifecycle (AO → SO → DO → MO → RO) for 200+ active enterprise orders — giving management live visibility that used to take days of manual consolidation.
// Overview
In Telkom's B2B operations, every enterprise order travels through a long lifecycle — AO (Agreement Order), SO, DO, MO, and finally RO (Revenue Order). Only completed orders generate revenue, so orders stuck in an early stage are invisible losses.
I designed and maintained the monitoring layer for this pipeline: Looker Studio dashboards fed by Oracle SQL extracts, with Google Apps Script automating the weekly reporting that previously consumed hours of manual copy-paste work.
// The Challenge
Order data lived scattered across operational systems, and nobody could answer "which orders are aging where?" without a manual exercise. Backlog grew silently, Billing Complete (BC) — the milestone that turns work into revenue — slowed down, and contracts with billing amounts outstanding over 2 months (BASO > 2 months) slipped through without systematic flagging.
// What I Built
A monitoring and reporting stack built from three pieces:
Order Ageing Dashboards
Looker Studio views over Oracle SQL extracts showing every order's stage, age, and owner — backlog prioritized at a glance.
Automated Weekly Reports
Google Apps Script jobs compile and deliver the weekly B2B performance report — cutting manual effort by ~60% while improving accuracy.
Revenue Variance Analysis
Oracle SQL analysis flagging BASO > 2 months to support Revenue Assurance, plus KPI alignment across Sales, Finance, and Operations.
// Results
+70%
Pipeline visibility (Q3 2024)
−35%
Order backlog
+25%
Billing Complete acceleration (QoQ)
~60%
Manual reporting effort cut
// Tech Stack
Need dashboard like this for your pipeline?
I build BI dashboards and reporting automation for operations teams — let's talk about yours.
Get in Touch