Dashboard BULOG Ciamis
Real-time procurement monitoring for BULOG Kancab Ciamis — tracking 4,500+ GKP rice-procurement rows live, turning reporting that took days into something that takes minutes.
// Overview
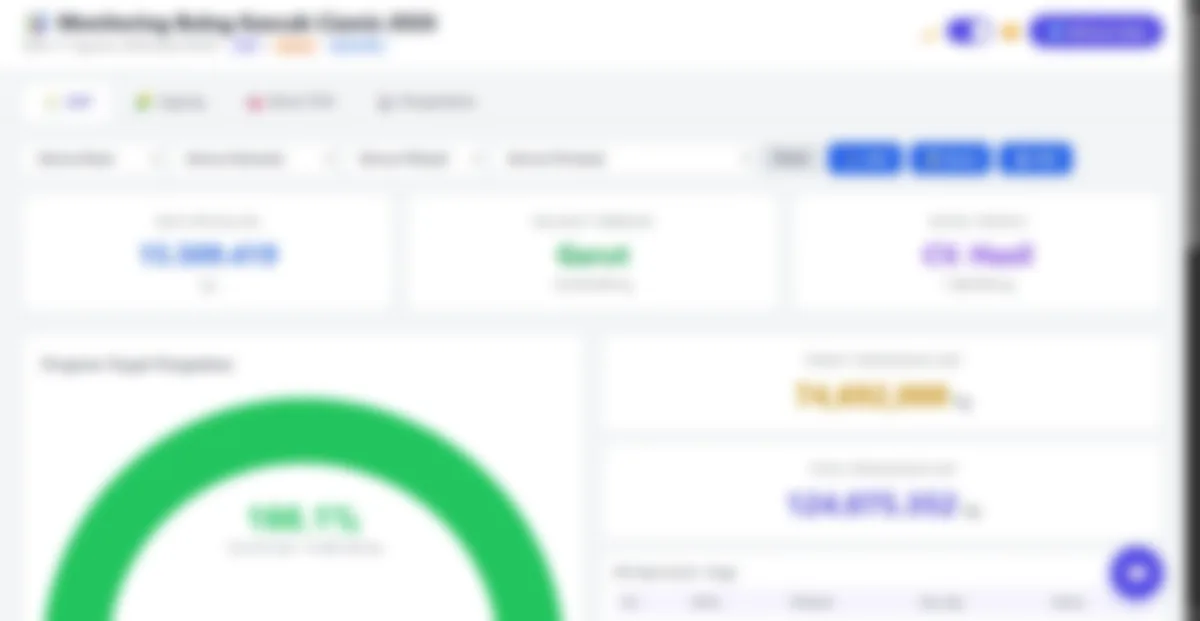
During the government rice procurement (PBP) program, BULOG Kancab Ciamis processes thousands of GKP receipt rows from field collection points. I built a Laravel web dashboard that pulls this data live from the office's Google Sheets via the Sheets API and presents it through Chart.js visualizations — real-time progress by date, supplier, and location.
// The Challenge
The field teams already worked in spreadsheets — that part was familiar and reliable. The problem was reporting: consolidating 4,500+ rows into numbers leadership could act on took days of manual aggregation every cycle, and by the time a report was ready, the data was already stale.
The constraint was equally clear: don't force the field teams to change their workflow. The solution had to read from the tool they already use.
// What I Built
A web dashboard that keeps the spreadsheet as the source of truth and automates everything above it:
Google Sheets as Live Source
Direct integration with the office spreadsheet via Google Sheets API — field teams keep their exact workflow.
Real-time Visualizations
Chart.js dashboards over 4,500+ GKP rows: procurement progress, trends, and breakdowns that update as data lands.
Days → Minutes Reporting
What previously required manual consolidation across days became a live view — leadership reads current numbers any time.
// Results
4,500+
GKP rows monitored live
Days → Min
Reporting turnaround
0
Workflow change for field teams
// Tech Stack
Still reporting from spreadsheets by hand?
I turn spreadsheet-based workflows into live dashboards without forcing teams to change tools.
Get in Touch